The 2025-26 Australian Federal Budget was handed down by Federal Treasurer Dr Jim Chalmers on…
Timing the market vs time in the market
 2022 was a turbulent period for financial markets. The Russian invasion of the Ukraine, along with high inflation, increasing interest rates and slowing economic growth has resulted in falling asset prices. There had been a 9.6% decline in the ASX 200 index up to the end of September last year, with larger falls in many international equity markets, property markets and bond indices.
Over the long run, equities have provided far superior returns to less risky assets such as bonds and cash, but this is also accompanied by higher volatility.
Declines in markets will often see investors seek out safety and move funds into cash. While this may provide some comfort in the short term, the cost of trying to time the market for extended periods can prove to be very high.
The current fall in context
To 30 September 2022, the ASX had fallen from 12% from its recent highs. This technically classifies the move as a correction (a fall greater than 10%), but not a bear market, which is a fall greater than 20%.
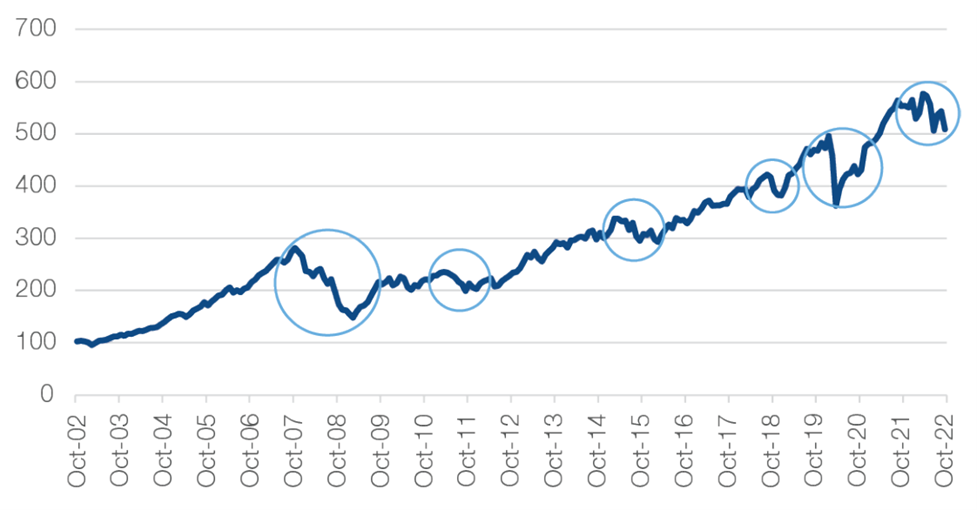
As shown in Chart 1, over the last 20 years, the market has experienced falls greater than 10% on 6 occasions, with falls of greater than 20% occuring twice. First, during the Global Financial Crisis of 2007/2008 and then the early stages ofthe COVID-19 pandemic in 2020.
Despite these period downward swings in markets, over the last 20 years, the value of an investment in the market has still increased five-fold.
Chart 1: ASX returns (rebased to 100)

Source: ASX, Fiducian
Time is your ally
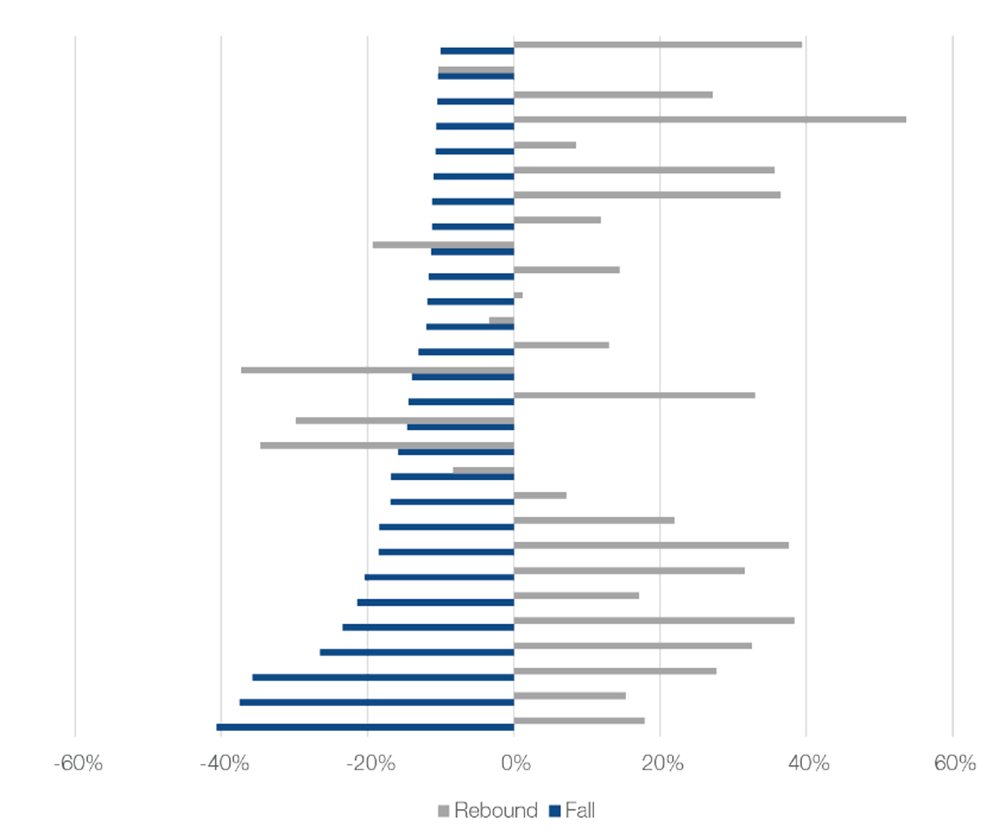
If we take the analysis back even further, since 1981, there have been 29 times where the rolling three-month return of the ASX (month end) has been -10% or worse, out of 501 observations. The median fall has been -13.9%.
However, after these falls, the historical experience has been that markets have generally rebounded strongly.
The subsequent 12 months from these points has seen a median return of +16.2%, against the usual 12-month market return of 9.9% for a one-year period. In 72% of cases, the 12-month return has been positive. The blue lines in Chart 2 represent market falls (from smallest to largest), and the grey line the return for the following 12 months.
Chart 2: Performance after drawdowns

Source: ASX, Fiducian
The costs of market timing
It can be tempting to believe that it is possible to ‘time’ the market by pulling out capital when markets are falling, and putting it back in when conditions improve. This usually proves to be very difficult in practice.
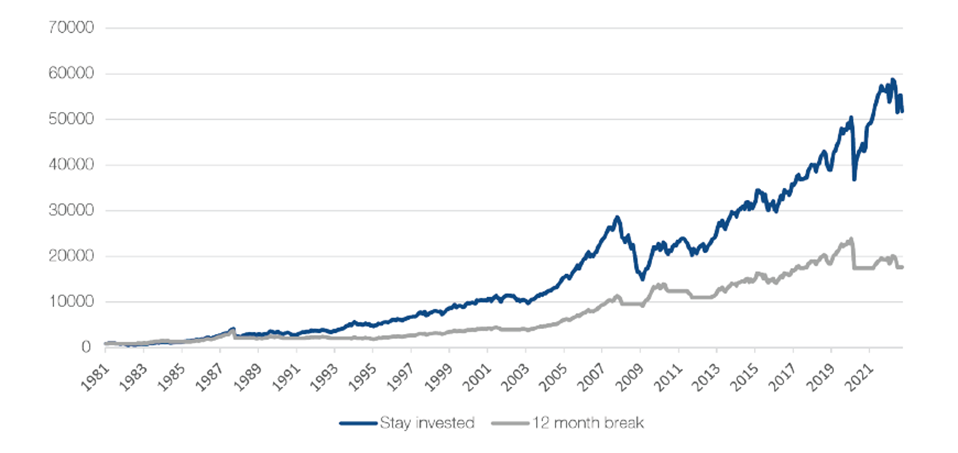
Let’s look at a trading rule. Imagine that every time the market falls by at least 10% over a three-month period, you decide to withdraw from the market, and wait 12 months until things calm down.
Chart 3 illustrates what a starting investment of $1,000 in 1981 looks like over 40 years where the blue line represents a ‘buy and hold strategy’, and the grey line a ‘timing strategy’.
Chart 3: Value of $1,000 *

Source: ASX, Fiducian
The average annual return for ‘buy and hold’ is 9.9% per annum. The ‘timing strategy’ has returned 7.1% per annum. The ‘timing strategy’ ends up being invested in the market 75% of the time, and out of the market for 25% of the time.
The end value for the ‘timing strategy’ is $17,654 whilst the end value for the ‘buy and hold strategy’ is $51,818 – almost triple the amount
Time in the market beats timing the market
Dealing with higher volatility, and observing the occasional large fall, is a necessary part of investing in risky assets such as equities. But, the rewards of being exposed to this asset class over the longer term are significant.
When markets fall, it can be tempting to seek out the safety of cash, but as the analysis above shows, more often than not, this will result in a much lower investment balance as the rebounds after falls can often be very quick and significant.*
*Past performance is not a reliable indicator of future performance and we do not guarantee any particular performance or any specific rate of return.
Source: www.fiducian.com.au
Lindale Insurances Pty Ltd ATF Lindale Insurances Trust ABN 27 027 421 832 is a Franchisee of Fiducian Financial Services Pty Ltd, Level 4, 1 York Street, Sydney NSW 2000. AFSL 231103 ABN 46 094 765 134.
The information (including taxation) provided on this website is general in nature and does not consider your individual circumstances or needs. Do not act until you seek professional advice and consider a Product Disclosure Statement.
Disclaimer: The views expressed in this publication are solely those of the author; they are not reflective or indicative of Fiducian. They cannot be reproduced in any form without the express written consent of the author.


